Everyone is aware that the FIDE ratings have become inflated. There is considerable excitement about Topalov and Anand becoming the 3rd and 4th players in history to reach ratings above 2800, but doubt about what this means. Of course it is flattering to modern players to have these high ratings, but surely an honest assessment is better for everyone than spurious (and widely doubted) records. Concrete information on this phenomenon seems hard to find on the web, so I did my own analysis. No explanations or remedies are offerred here, only a perspective on the available data.
A test for rating integrity is to check whether an average measure of the top of the rating pool remains consistent. I decided to use the average of the 11th to 50th ranked players in the FIDE rating lists I could find (I don't have all of them, but enough to draw a firm conclusion). I excluded the top ten to avoid possible effects of uncommon genius. If too few are averaged, variability will be greater. If too many are averaged, there is the possibility that earlier rating lists, which contained fewer players, might be missing some players who should be included. Using somewhat more or less than the top 50 produced similar results in any case.
I made some minor modifications to the lists: I restored Kasparov and Short to the 1994 lists (where they had been excluded because of disagreements between them and FIDE). Fischer reappeared in the FIDE lists in the early 1990's after his second match with Spassky, but his rating was left at 2780, where it had been in 1973. I removed Fischer from these lists, except the Jan. 1993 list, immediately after the match, where I put him at 2620, which is a performance rating based on his result in that match against Spassky, who at the time had a rating of 2560. The very earliest ratings lists, though published in 1970, reflected results only up until part way through 1969 and are dated accordingly.
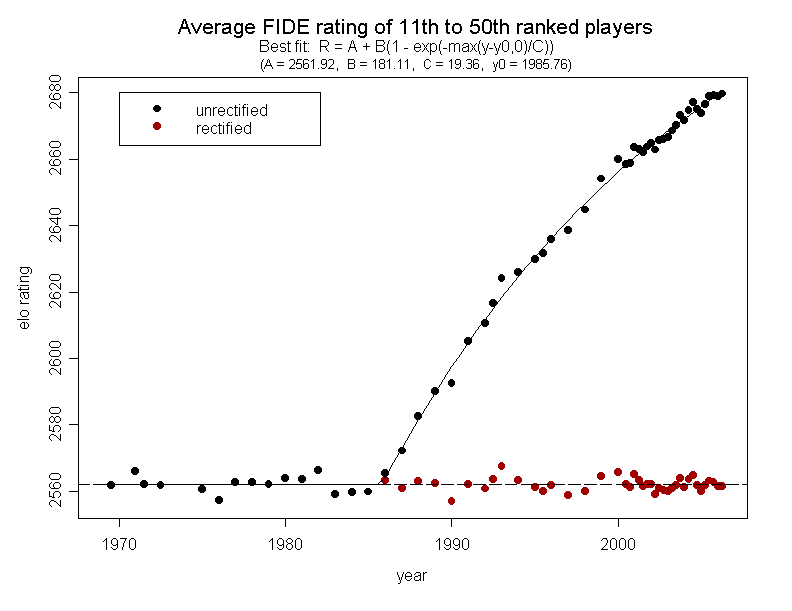
The graph below shows the average of the 11th to 50th ranked
players in the rating lists from which I have enough information (in
black). It is remarkably clear that there was a sudden onset of the
inflation around 1986, and a steady rise since then, though at a rate
that has been diminishing slightly. I fit this data to a function of
the form
|
R is the average rating of the 11th to 50th ranked players.
A is the baseline for this average, which appears pretty consistent in
the earlier years.
C determines the rate of the inflation (which the function assumes is
an exponential approach towards a maximum rating of A+B).
Finally, Y0 determines the moment at which the inflation
begins.
Whether this is ultimately the correct form of the inflation or not, it should be evident from the graph below that it fits the data extremely well, with the optimal values A=2562, B=181, C=19.4, and Y0=1985.76. The solid black line shows this best fit curve. The 'rectified' averages, in which the inflation has been subtracted, are shown in red.

The implication is that the inflation began late in 1985 (first being noticable in the Jan. 1986 list), and has grown by April 2006 to about 118 rating points. I don't know if some particular change was made to rating procedures around 1985, but such a change is suggested by the data. The sharp onset of the rating increase would also seem to be strong evidence against the idea that play is simply improving gradually over the years and that the increases are real.
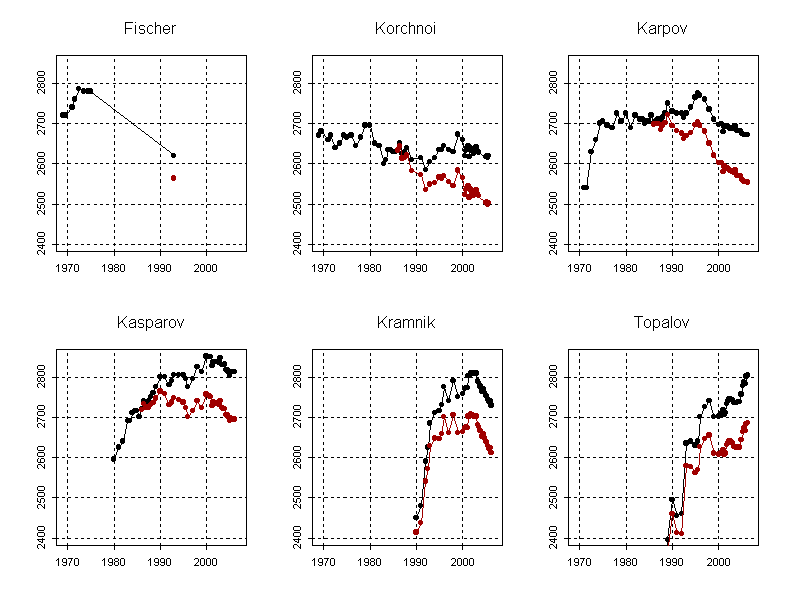
Now let's see how this affects the ratings of our current World Championship contenders, Kramnik and Topalov, in comparison to some of the other top players of the era of FIDE ratings, Fischer, Korchnoi, Karpov and Kasparov. The graphs below show the effect of the inflation on the ratings of these players. Unrectified ratings are in black, rectified ratings (from 1986) in red.

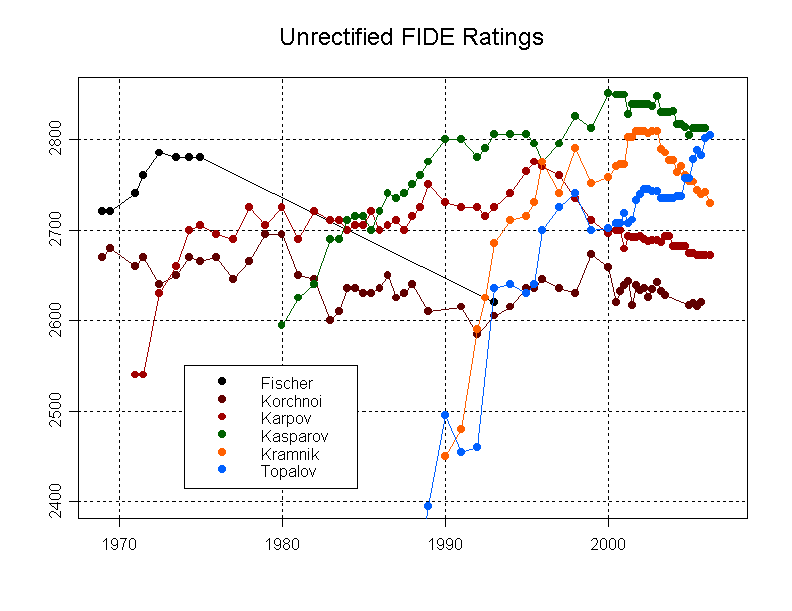
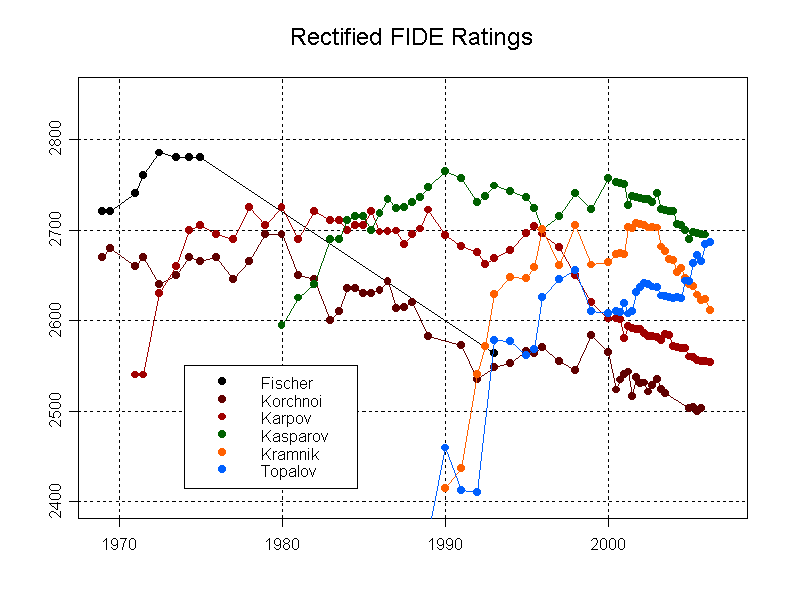
I have also put all 6 players together so that they may be compared, before or after the rectification.


Note that Kasparov's unrectified peak was 2851 in Jan. 2000, but after the rectification, we see that his rating in Jan. 2000 should have been 2750 and that his Jan. 1990 peak was slightly higher at 2764. Notably, this does not quite match Fischer's peak of 2785 in 1973.
Similarly, Karpov's peak was not in 1995, but over the period 1978 - 1989. Karpov's peak is clearly 3rd after Fischer and Kasparov, and not exceeded (yet) by the newest generation, as the unrectified ratings would suggest.
The unrectified ratings suggest that Korchnoi held a pretty steady rating between 2600 and 2700 through the entire period from 1969 to 2006. The rectified ratings show a more plausible decline.
Our current championship contenders, Kramnik and Topalov, still have very respectable ratings after the rectification, though nowhere near the unrealistic 2800+ level before rectification, which would put them above Fischer at his peak. The rectification suggests that Kramnik broke into the 2700's in the late 1990s and early this decade, putting him higher than Korchnoi's peak, higher than Spassky for that matter during his tenure as world champion, and close to, but not quite at, Karpov's peak level. Topalov has reached a level similar to Spassky's and Korchnoi's peaks, and is still no doubt improving.
It may also be worth noting that the general conclusions here are consistent with the Chessmetrics ratings of Jeff Sonas.
To calculate a rectified rating from a published FIDE rating list, subtract the amount in the table below:
|
|
|
|
|